|
Major Findings
Political Participation
There was reason to believe that we would find a low level of political
participation among Holy Cross students. Voter turnout has declined
in recent years; in the last Presidential election, barely a majority
of the American population voted; and young people are less likely to
vote than other age groups. Table 6.1 summarizes the results of a series
of questions on various forms of political participation. Perhaps the
most fundamental form of participation is voting. None of the Holy Cross
students we interviewed was ineligible to vote at the time of the interview;
yet 29 percent had not registered to vote. When those not registered
were asked if they planned to register so that they could vote in the
November election, only 14 students, 7 percent of the sample, answered
"no." Among those already registered, two-thirds had voted
at least once in a local, state, or national election, which means that
less than half of the sample had exercised their right to vote. Finally,
only about one-quarter of the respondents reported that they had voted
more than once in a civic election.
Table 6.1. Percentage of Holy Cross students who engaged in various
forms of political participation.
|
Form of Political Participation
|
Percent
|
|
Registered to vote in a civic election
|
70.8
|
|
Voted at least once in a civic election
|
46.7
|
|
Voted more than once in a civic election
|
23.6
|
|
Discussed politics with others 2-3 times a month
or more
|
89.2
|
|
Contacted a public official about some need or
problem
|
53.3
|
|
Tried to influence others to vote for one of
the parties or candidates in an election
|
43.6
|
|
Worn a campaign button or displayed campaign
sticker in an election
|
36.9
|
|
Worked for one of the parties or candidates in
an election
|
19.5
|
As Table 6.1 further shows, the vast majority of Holy Cross students
had discussed politics with others on occasion, and a third or more
students had contacted a public official about a problem, tried to influence
others to vote for a particular candidate, and worn a campaign button
or displayed a campaign sticker during an election. In addition, one
in five had worked for one of the parties or candidates in an election.
These data indicate that Holy Cross students' reported level of political
participation generally is high compared with the American electorate.
In National Election Studies over the past four decades, for example,
about 30 percent of U.S. citizens report that they tried to persuade
others during a Presidential campaign, roughly 10 percent say that they
had worn a campaign button or put a campaign sticker on their car; and
fewer than 5 percent claim that they had worked on a campaign. Only
with respect to voting are Holy Cross students less active politically;
however, many students only recently became eligible to vote in a civic
election, and very few have had the opportunity to vote in a Presidential
election.
Political Knowledge and Interest in Politics
Two questions gauged students' knowledge of politics. Who is the governor
of your state of residence? Who is the Congressman from your district
back home? When these questions were asked in one 1989 national survey,
73 percent of the respondents could name their governor and 29 percent
could name their U.S. representative. In the spring HCSS, 67 percent
of the students knew their governor and 22 percent knew their representative.
Three-fifths of the respondents were from three states-Massachusetts,
New York, and Connecticut. Residents of Massachusetts were less likely
to know their governor (69%; Mitt Romney) than those from New York (80%;
George Pataki) and Connecticut (95%; John Rowland).
We used three NES questions to ask about students' interest in politics:
How interested have you been in following the political campaigns this
year? Do you care which Party wins the Presidential election this fall?
How much do you follow what's going on in government and public affairs?
Table 6.2 compares the spring 2004 HCSS with NES surveys in 2000 or
2002. The data show comparable levels of interest in Holy Cross students
and the American electorate in general.
Table 6.2. Percentage of HCSS sample and NES samples who reported that
they were "very much" interested in following the current
political campaigns, "cared a good deal" which party wins
the November Presidential election, and follow what's going on in government
and public affairs "most of the time."1
|
|
HCSS
|
NES '00
|
NES '02
|
|
Very much interested in following the current
political campaigns
|
24
|
-
|
27
|
|
Care a good deal about which party wins the Presidential
election
|
74
|
76
|
-
|
|
Follow what's going on in government most of
the time
|
36
|
-
|
27
|
1 For exact question wording, see the spring 2004 HCSS Questionnaire.
Historically, men have been more engaged in politics than women. Consistent
with this pattern, Holy Cross men were more knowledgeable about and
more interested in politics according to all the above indicators; however,
only one difference-naming the U.S. representative-was statistically
significant. Illustrating the relation between action, cognition, and
attitudes, registered voters in the HCSS were significantly more likely
to know their state governor and representative and to be interested
in politics and public affairs than respondents who were not registered.
Political Ideology and Party Preference
When asked to place themselves on a seven-point scale of political views
ranging from "extremely liberal" to "extremely conservative,"
45 percent of the Holy Cross sample identified themselves as liberal,
25 percent as "middle-of-the-road," and 29 percent as conservative.
By comparison, the 2004 GSS showed that more Americans nowadays identify
themselves as conservative (38%) than liberal (25%).
Students' political views also were tapped by asking them to use a "feeling
thermometer" to express their feelings toward particular groups.
Ratings on the thermometer may vary from 0 to 100 degrees; ratings between
50 and 100 degrees mean that respondents "feel favorably or warm
toward the group," whereas ratings between 0 and 50 degrees mean
that they "do not feel favorably toward or care much about the
group." Table 6.3 shows the average ratings for several groups
broken down by respondent's political ideology-liberal, middle-of-the-road,
and conservative. Political ideology was associated with all group ratings,
most strongly with Democrats, Republicans, liberals, and conservatives.
Overall, students expressed relatively strong positive feelings toward
the military, the police, and environmentalists; they expressed negative
feelings only toward Christian fundamentalists, although many students
refused to rate this group because they said they didn't know anything
about them.
Table 6.3. Feeling thermometer ratings for different groups by political
ideology.
|
Feelings toward . . . .
|
Liberal
|
Middle-of-the road
|
Conservative
|
Whole Sample
|
|
Democrats
|
73.7
|
61.2
|
47.6
|
62.9
|
|
Republicans
|
38.8
|
52.2
|
68.6
|
50.9
|
|
Liberals
|
71.2
|
52.9
|
38.7
|
57.0
|
|
Conservatives
|
40.0
|
51.1
|
64.3
|
50.0
|
|
Military
|
62.1
|
67.9
|
77.2
|
68.1
|
|
The police
|
64.3
|
69.3
|
71.7
|
67.7
|
|
Feminists
|
63.1
|
55.7
|
41.4
|
54.8
|
|
Environmentalists
|
70.5
|
60.6
|
53.8
|
63.1
|
|
Christian fundamentalists
|
33.4
|
43.6
|
43.6
|
38.9
|
|
N
|
(88)
|
(48)
|
(57)
|
(193)
|
To measure political party identification, we first asked if respondents
thought of themselves as Republican, Democrat, Independent, or something
else. Then, as in the NES, we asked those who identified themselves
as Independents whether they leaned toward the Republican or Democratic
Party. In response to the initial question, 28 percent of the HCSS sample
claimed they were Republicans, 37 percent claimed they were Democrats,
and 29 percent Independents. Among the Independents, 26 percent thought
of themselves as closer to the Republican Party and 59 percent as closer
to the Democratic Party. These "independent partisans," research
has shown, consistently vote for the nominee of their party and, therefore,
have been labeled "covert" Republicans and Democrats. When
we add the independent partisans to get a more accurate reading of party
"preference," 58 percent of HCSS respondents support the Democratic
Party, 36 percent support the Republican Party, and 5 percent are Independents.
One of the most important influences on political partisanship is a
person's family of origin. We asked students to tell us, when they were
growing up, whether their father identified himself mostly as a Democrat
or a Republican and whether their mother identified herself mostly as
a Democrat or a Republican. Fathers were more likely to be perceived
as Republicans, whereas mothers were more likely to be perceived as
Democrats. Almost three-quarters (72%) of the parents were reported
as having the same party (or nonparty) preference; in 17 percent of
the families, one parent, usually a mother, was a Democrat and the other
was a Republican. Considering students who identified themselves as
Democrats or Republicans or partisan Independents, 63 percent had the
same party preference as their father and 64 percent had the same preference
as their mother. When both parents were Republicans, 72 percent of the
time respondents identified themselves as Republicans; when both parents
were Democrats, 94 percent of the time respondents identified themselves
as Democrats. So, there was considerable agreement between a student's
political party preference and that of his or her parents.
Support for Government and Approval of the
President
For the second time in the HCSS, we asked students how often they thought
they could trust the government in Washington to do what is right and
how satisfied they were with the direction the country is going at this
time. A 2002 NES survey found that 56 percent of a national sample thought
one could trust the federal government to do what is right "most
of the time" or "just about always." The first time this
question was posed in the HCSS, in spring 2003, 58 percent of the sample
expressed the same moderately high level of trust; a year later, in
spring 2004, a nearly identical 57 percent responded in the same way.
Similarly, in both HCSS surveys, almost exactly the same percentage
of respondents, 58 and 57, were "somewhat" or "very satisfied"
with the direction that the country was going. An only slightly lower
54 percent of the spring 2004 HCSS respondents also said that they approved
of the way President George W. Bush was handling his job as President.
Responses to these three questions in the current survey were moderately
to strongly correlated with one another, suggesting that they are measuring
the same underlying attitude toward the current administration. Despite
their Democratic and liberal leanings, Holy Cross students tend to have
a favorable attitude.
Interest and Voting Intentions in the 2004
Presidential Election
Respondents were about equally divided in their attention to the November
election: 48 percent reported that they had given "quite a lot"
of thought to the upcoming Presidential election and 45 percent said
that they had given "only a little" thought to it. The vast
majority-88 percent-predicted that the election would be close. If the
election were held at Holy Cross in April 2004, however, there would
have been a clear winner. When asked who they would be more likely to
vote for, assuming that John Kerry and George W. Bush were their Party's
candidates, 57 percent of the respondents chose Kerry and 39 percent
chose Bush. This difference narrowed to a 56/41 split when we considered
only students registered to vote or planning to register so they could
vote in the November election. Kerry and Bush supporters were equally
likely to think that the presidential race would be close, but Kerry
supporters, perhaps because of the salience of the primaries, were more
likely to report that they had given "quite a lot" of thought
to the election. Also, as expected, Democrats overwhelmingly (93%) supported
Kerry and Republicans overwhelmingly (94%) supported Bush; among the
seven nonpartisan Independents, four supported Kerry and three supported
Bush.
Involvement in Student Government
Another form of political participation is involvement in student government.
Following the questions on local and national politics, we asked five
questions about varying degrees of participation in campus politics.
Table 6.4 presents the percentage of students who answered "yes"
to these questions.
Table 6.4. Percentage of students who reported different forms of participation
in student government.
|
Form of Participation in Student Government
|
Percentage
|
|
Voted in a student election at Holy Cross
|
75
|
|
Attended a SGA General Assembly Meeting
|
33
|
|
Ran for office, such as House Council, class
officer, or SGA Senator
|
16
|
|
Served on the House Council in a residence hall
|
11
|
|
Served in the SGA as an elected or appointed
representative
|
14
|
While three-quarters of the respondents had voted in a student election,
only a third had ever attended a General Assembly Meeting of the Student
Government Association, and fewer than one in six had run for office
or served in a position of governance leadership. Participation is partly
a matter of opportunity; student elections are held twice a year and
the SGA General Assembly Meetings are held about once a month. First-year
students, having had fewer chances to participate in student government,
were significantly less likely than others to have voted in a student
election and to have attended a SGA General Assembly Meeting. However,
only attendance at SGA Meetings showed a clear linear trend, with 14
percent of first-year students, 28 percent of second-year students,
38 percent of third-year students, and 50 percent of fourth-year students
having attended a meeting.
Is involvement in student government associated with broader political
engagement? To see, we created two indices: an index of political participation
consisting of the sum of the indicators in Table 6.1 and an index comprised
of the sum of the "yes" responses to the five items in Table
6.4. There was indeed a significant positive correlation between these
measures: as student involvement in campus politics increased, so did
their political participation beyond the campus. This correlation decreased
somewhat when controlling for academic class, but was still significant.
In addition to political participation, involvement in campus politics
was related to attention to political campaigns and interest in government
and public affairs.
Opinions on Current Issues
Another facet of politics is public opinion on public policy issues.
We limited HCSS questions to the War in Iraq, the economy, and a few
of the more prominent and controversial social issues of the day. Before
we asked for students' opinions on specific issues, however, we asked
a general question that has been posed repeatedly in national surveys:
What do you think is the most important problem facing this country
today? When this question was asked around the same time as the spring
HCSS, April 5-8, in a Gallup poll of 1,014 adults, four problems accounted
for almost 80 percent of the responses: War in Iraq (26%), economy in
general (22%), unemployment/jobs (17%), and terrorism (13%).
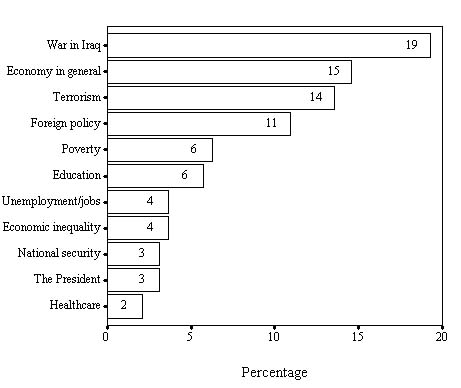
Figure 6.1. Problems identified by 2 percent or more respondents as
"the most important problem facing the country today."
Figure 6.1 shows the problems identified by 2 percent or more of the
spring HCSS sample. Holy Cross students specified the same top two problems
as in the Gallup poll and also ranked terrorism highly; otherwise their
responses appear to be more diverse and represent a slightly different
set of priorities. Unemployment was not mentioned nearly as often in
the HCSS as in the Gallup poll, although some students may have had
this in mind when they answered "the economy." Perhaps due
to differences in coding, neither foreign policy nor economic inequality
emerged as a problem in the Gallup poll, but were mentioned in the HCSS.
In the HCSS, Republicans were more likely to identify terrorism as the
most important problem facing the country today and Democrats were more
likely to identify foreign policy or foreign affairs; otherwise, their
choices were similar. Also, women were more than twice as likely as
men to say that the War in Iraq was the main problem.
At the beginning of the war, about 7 in 10 Americans thought that the
U.S. had made the right decision in using military force against Iraq.
But by the time of survey, with almost daily reports of bombings and
American military casualties in Iraq, support for the War had declined
markedly. A Gallup poll in early April found that 50 percent of Americans
thought it "was worth going to war in Iraq" and 47 percent
that it was "not worth it"; in another contemporaneous nationwide
poll, 43 percent thought it was worth it and 51 percent thought it was
not worth it. In a December 2003 CNN/USA Today/Gallup Poll, 56 percent
of Americans said the war with Iraq had made the U.S. safer from terrorism;
six months later, 55 percent said that it had made the U.S. less safe.
On the other hand, an ABC News/Washington Post poll in mid-April indicated
that 57 percent of Americans believed that the war with Iraq had contributed
to the long-term security of the U.S.
Holy Cross students expressed somewhat similar sentiments. Like the
majority of Americans at the time of survey, 54 percent thought the
war had contributed to the long-term security of the U.S. Similarly,
56 percent said that the U.S. had done the right thing in taking military
action against Iraq. Still, 63 percent believed that "going to
war with Iraq has not made Americans safer from terrorism." Also
like the American public, a clear split in these opinions occurred along
party lines, with Republicans expressing much stronger support for the
war than Democrats. For example, 90 percent of Republicans versus 35
percent of Democrats believed that invading Iraq was the right thing
to do; 81 percent of Republicans versus 40 percent of Democrats believed
the war had contributed to U.S. long-term security.
With respect to the economy, Holy Cross students' views were slightly
more positive and more optimistic than the general public. When asked
how they would rate economic conditions in the country today, 42 percent
of the HCSS sample said "excellent" or "good," 47
percent said "only fair," and 10 percent said "poor";
by comparison, 34 percent of Americans in an April 5-8 Gallup poll said
excellent or good, 44 percent only fair, and 22 percent said poor. When
asked whether they thought "economic conditions in the country
as a whole are getting worse or getting better," 54 percent of
Holy Cross students said better, 35 percent said worse, and 10 percent
said neither. In the same Gallup poll by comparison, 47 percent of Americans
said better and 45 percent worse. As with the war in Iraq, Republicans
and Democrats differed on both of the questions, with Republicans far
more likely than Democrats to rate economic conditions favorably.
Finally, we tapped opinions on three social issues of the day: abortion,
gay marriage, and capital punishment. The single question on abortion
that was included in the survey addressed specific attitudes about its
legality. Respondents were handed a card and asked to choose one of
four "opinions." Table 6.5 shows the percentages of students
selecting each option. A small minority (10%) opposed legalized abortion
under any circumstances, and a little more than a third favored abortion
as a matter of personal choice; but like the American public, the majority
favored restrictive laws. In an October 2003 Gallup poll, by comparison,
54 percent of the public said that abortion should be legal "only
in a few" or "under most circumstances."
Holy Cross students and the American public diverge on the issues of
gay marriage and capital punishment. Recent polls show the American
public about equally divided on whether homosexual couples should be
allowed "to legally form civil unions," but a clear majority
opposed to legalizing gay marriage and a scant majority who support
a Constitutional amendment that would "define marriage as being
between a man and a woman" (see The Gallup Tuesday Briefing, May
2004, pp. 21-23). By contrast, 86 percent of students in the spring
HCSS said that homosexual couples should be allowed to legally form
civil unions; 72 percent supported gay marriage, and only 8 percent
supported "amending the Constitution to make it illegal for homosexual
couples to get married anywhere in the U.S." In large part, Holy
Cross students' position on gay marriage may be a product of two factors:
age and education. Nationally, younger people and the more educated
most strongly support gay marriage.
Table 6.5. Percentage of students selecting each of four legal positions
on abortion.
|
Opinions on the Legality of Abortion
|
Percent
|
|
1. By law, abortion should never be permitted
|
10
|
|
2. The law should permit abortion only in case
of rape, incest, or when the woman's life is in danger
|
33
|
|
3. The law should permit abortion for reasons
other than raped, incest, or danger to the woman's life, but only
after the need for abortion has been clearly established
|
21
|
|
4. By law, a woman should always be able to obtain
an abortion as a matter of personal choice
|
35
|
|
No answer or no opinion
|
1
|
Despite mounting opposition to capital punishment in recent years,
the American public has continued its strong, long-term support for
the death penalty. The question we asked in the HCSS-"Do you favor
or oppose the death penalty for persons convicted of murder?"-was
drawn from the General Social Survey. Throughout the 1980s and 1990s,
three-quarters of GSS respondents answered affirmatively. Spring 2004
was the second time we included this item in the HCSS. Both times, the
majority of students were opposed to the death penalty: 54 percent in
spring 2002 and 55 percent in spring 2004. Interestingly, 19 percent
of the respondents in 2002 and 5 percent of those in 2004 answered "don't
know" or refused to answer the question. Unlike gay marriage, neither
age nor education is a strong predictor of support for capital punishment.
On this issue, it is possible that students are influenced by Church
teachings.
On all three social issues, Democrats versus Republicans and liberals
versus conservatives in the HCSS were sharply divided. Democrats and
liberals were far more likely than Republicans and conservatives to
oppose capital punishment and to believe that abortion should be a matter
of individual choice and gay marriage should be legal. Further, academic
class standing appeared to have a liberalizing effect, with fourth-year
students most "liberal" and first-year students least "liberal"
on all three issues. Whether this is due to the influence of aging among
18-22 year-olds or to something unique about the college experience,
we cannot say.
return to top
|