|
|
Major Findings
Political Participation
Table 9.1 summarizes the results of a series of questions on various forms of political participation which were asked both in spring 2004 and spring 2008. Perhaps the most fundamental form of participation is voting. In spring 2008, all of the Holy Cross students we interviewed were eligible to vote by the time of the survey; yet 21 percent had not registered. When those not registered were asked if they planned to register so that they could vote in the November election, only 15 students, 4.4 percent of the sample, answered “no.” Among those already registered, nearly two-thirds had voted at least once in a local, state, or national election; thus, half the sample had exercised their right to vote. Finally, one-quarter of the respondents reported that they had voted more than once in a civic election.
Table 9.1. Percentage of Holy Cross students who engaged in various forms of political participation, Spring 2004 and Spring 2008.
Form of Political Participation |
2004 |
2008 |
Registered to vote in a civic election |
70.8 |
79.4 |
Voted at least once in a civic election |
46.7 |
50.3 |
Voted more than once in a civic election |
23.6 |
25.0 |
Discussed politics with others 2-3 times a month or more |
89.2 |
85.6 |
Contacted a public official about some need or problem |
53.3 |
38.3 |
Worked for one of the parties or candidates in an election |
19.5 |
13.8 |
Tried to influence others to vote for one of the parties or candidates |
43.6 |
55.9 |
Worn a campaign button or displayed campaign sticker |
36.9 |
30.3 |
As Table 9.1 further shows, the vast majority of Holy Cross students had discussed politics with others on occasion, more than half had tried to influence others to vote for a particular candidate, and around a third had contacted a public official about a problem or worn a campaign button or displayed a campaign sticker during an election. In addition, one in seven had worked for one of the parties or candidates in an election. These figures do not differ significantly from those of spring 2004, with two exceptions. In 2004, students were more likely to report that they had contacted a public official; and in spring 2008, students were more likely to have tried to influence others to vote for a candidate. It is possible that the latter difference reflects the primary campaigns in these years. Both party nominations were up for grabs in 2008, whereas in 2004, an incumbent President was not challenged for the Republican nomination, and the Democratic candidate John Kerry locked up his party’s nomination after the first few primaries.
These data indicate that Holy Cross students’ reported level of political participation generally is high compared with the American electorate. In National Election Studies over the past four decades, for example, about 30 percent of U.S. citizens report that they tried to persuade others during a Presidential campaign, roughly 10 percent say that they had worn a campaign button or put a campaign sticker on their car; and fewer than 5 percent claim that they had worked on a campaign. Only with respect to voting are Holy Cross students less active politically; however, many students only recently became eligible to vote in a civic election, and very few have had the opportunity to vote in a Presidential election. That will change this November, when 92 percent of Holy Cross students reported that they planned to vote.
Political Ideology and Party Preference
When asked to place themselves on a seven-point scale of political views ranging from “extremely liberal” to “extremely conservative,” 45 percent of the Holy Cross sample identified themselves as liberal, 23 percent as “middle-of-the-road,” and 33 percent as conservative. By comparison, the 2006 GSS showed that more American nowadays identify themselves as conservative (35%) than liberal (26%).
To measure political party identification, we first asked if respondents thought of themselves as Republican, Democrat, Independent, or something else. Then, as in the NES, we asked those who identified themselves as Independents whether they leaned toward the Republican or Democratic Party. In response to the initial question, 27 percent of the HCSS sample claimed they were Republicans, 39 percent claimed they were Democrats, and 29 percent Independents. Among the Independents, 34 percent thought of themselves as closer to the Republican Party and 52 percent as closer to the Democratic Party. These “independent partisans,” research has shown, consistently vote for the nominee of their party and, therefore, have been labeled “covert” Republicans and Democrats. When we add the independent partisans to get a more accurate reading of party “preference,” 56 percent of HCSS respondents support the Democratic Party, 38 percent support the Republican Party, and 5 percent are Independents. Overall, students’ reported political orientation and party preference in 2008 are nearly identical to 2004. (See results of spring 2004 HCSS).
One of the most important influences on political partisanship is a person’s family of origin. We asked students to tell us, when they were growing up, whether their father identified himself mostly as a Democrat or a Republican and whether their mother identified herself mostly as a Democrat or a Republican. Fathers were more likely to be perceived as Republicans, whereas mothers were more likely to be perceived as Democrats. About two-thirds (68%) of the parents were reported as having the same party (or nonparty) preference; in 17 percent of the families, one parent, usually a mother, was a Democrat and the other was a Republican. Considering students who identified themselves as Democrats or Republicans or partisan Independents, 60 percent had the same party preference as their father and 56 percent had the same preference as their mother. When both parents were Republicans, 65 percent of the time respondents identified themselves as Republicans; when both parents were Democrats, 89 percent of the time respondents identified themselves as Democrats. So, there was considerable agreement between a student’s political party preference and that of his or her parents.
Political Interest
We used two NES questions to ask about students’ interest in politics: How much do you follow what’s going on in government and public affairs? How interested have you been in following the political campaigns this year? Table 9.2 compares the spring 2004 and spring 2008 HCSS with the 2004 NES Pre-Election Survey. The data show comparable levels of interest in Holy Cross students and the American electorate in general.
Table 9.2. Percentage of spring 2004 and spring 2008 HCSS samples and 2004 NES pre-election sample who reported that they follow what’s going on in government and public affairs “most of the time” and were “very much” interested in following the current political campaigns.1
|
HCSS 2004 |
HCSS 2008 |
NES 2004 |
Follow what’s going on in government most of the time |
24 |
29 |
26 |
Very much interested in following current political campaigns |
36 |
35 |
40 |
1 For exact question wording, see the spring 2008 HCSS Questionnaire.
Voting Intentions in the 2008 Presidential Election
At the time of the survey, John McCain had secured the Republican Party nomination and the Democratic nomination essentially had boiled down to two candidates: Barack Obama and Hillary Clinton. We therefore asked respondents to think ahead to the Presidential election and to indicate for whom they would vote if the candidates were (1) McCain and Clinton and (2) McCain and Obama. At Holy Cross in February and March 2008 the outcome differed markedly depending on the Democratic nominee. McCain was chosen by 54 percent of the respondents when his opponent was Clinton, but by only 38 percent when he was projected to run against Obama. When we considered only students who planned to vote in the November election, the gap widened slightly with Clinton (56/44) and narrowed slightly with Obama (39/61).
Although the vast majority of students supported their party’s candidate, Democrats were more likely to cross party lines when Clinton ran against McCain and Republicans were more likely to cross party lines when McCain ran against Obama. For example, excluding Independent partisans, 95 percent of Republicans supported McCain versus Clinton but 85 percent supported him against Obama; 92 percent of Democrats supported Obama versus McCain but 81 percent supported Clinton versus McCain. Women were more likely to support Clinton than men; however, that was due to the fact that women were more likely to be Democrats. When controlling for party preference, gender was unrelated to candidate choice. Similarly, nonwhites were more likely to support Obama, but this difference disappeared when controlling for party.
Support for Government and Approval of the President
We asked students how often they could trust the government in Washington to do what is right, how satisfied they were with the direction the country is going at this time, and whether they approved of the way George W. Bush is handling his job as President. Table 9.3 reports results for these three questions from the spring 2004 and spring 2008 HCSS. In both surveys, responses were moderately correlated with one another, suggesting that these questions may be measuring the same underlying attitude toward the current administration.
Table 9.3. Percentage of spring 2004 and spring 2008 HCSS respondents who reported that they trust the government to do what is right “most of the time” or “just about always,” were “somewhat” or “very satisfied” with the direction that the country is going, and approved of the way George W. Bush was handling his job as President.1
|
2004 |
2008 |
Can trust government to do what is right most of time or just about always |
57 |
40 |
Somewhat or very satisfied with direction country is going |
57 |
45 |
Approve of way George W. Bush is handling his job as President |
54 |
21 |
In 2004, 57 percent of the respondents thought one could trust the federal government to do what is right “most of the time” or “just about always.” (By comparison, in a 2004 NES survey, 47 percent of a national sample was as trusting.) Also in 2004, exactly the same percentage of respondents, 57, were “somewhat” or “very satisfied” with the direction of the country, and an only slightly lower 54 percent approved of the way Bush was handling his job. Four years later, in 2008, students were less trusting (40%), less satisfied with the direction of the country (45%), and less approving of Bush (21%). Compared with current national polls, on the other hand, Holy Cross students appear to be more satisfied with the direction of the country, but give Bush a lower approval rating. For example, a February Newsweek poll found that 24 percent were satisfied “with the way things are going in the United States at this time,” and a late-February Los Angeles Times/Bloomberg Poll found that 26 percent thought “things in this country are generally going in the right direction.” In addition, Bush’s approval rating varied between 28 and 34 percent In 14 different national polls conducted during the time of the HCSS.
Political Knowledge
To measure how politically informed Holy Cross students are, we used an index recommended by Delli Carpini and Keeter (1993) which consists of five questions from NES surveys. Table 9.4 presents the questions as well as the percentage of respondents in the 2008 HCSS and in the 1991-1992 NES who answered correctly. Unfortunately, the NES did not continue to use most of these questions; so, we cannot present more recent national data. One source (Zukin et al., 2006) showed that such factual knowledge has declined across generations, with the youngest—DotNets, born after 1976—the least informed. In a 2002 NES survey, for example, only 40 percent of this age group knew that Republicans were more conservative than Democrats.
Table 9.4. Percentage of Holy Cross students and 1991-1992 NES respondents who answered each knowledge question correctly.1
Question2 |
HCSS |
NES3 |
1. What job or political office is now held by Dick Cheney [current VP]? |
86 |
88 |
2. Whose responsibility is it to determine if a law is constitutional or not? |
72 |
58 |
3. How much of a majority is required for the U.S. Senate and House to
override a Presidential veto? |
59 |
37 |
4. Which party currently has the most members in the House of
Representatives? |
52 |
59 |
5. Which party is more conservative than the other at the national level? |
95 |
57 |
|
|
|
Mean number of correct answers |
3.6 |
3.0 |
1 For exact question wording, see the spring 2008 HCSS Questionnaire.
2Answers: 1. Vice President; 2. Supreme Court; 3. two-thirds; 4. Democratic; 5. Republican.
3Question 3 asked in 1991; all other questions asked in 1992.
Historically, men have been more politically involved than women, and several studies have shown that men are more knowledgeable about politics. In the 2004 HCSS, when we asked Holy Cross students to name the governor from their home state and U.S. representative from their home district, we found no gender gap in naming their governor, but men were more likely than women to know their Congressman. In the 2008 HCSS, men had a significantly higher mean score on the knowledge index than women (3.97 vs. 3.35). Also illustrating the relation between action, cognition, and attitude, students who had registered to vote scored higher on the knowledge index and expressed greater interest in politics and public affairs than those who were not registered.
Involvement in Student Government
Another form of political participation is involvement in student government. Following the questions on local and national politics, we asked three questions about varying degrees of participation in campus politics. Table 9.5 presents the percentage of students who answered “yes” to these questions. We found about the same level of participation in spring 2004. Academic class was related to all three indicators of involvement. In particular, first-year students, having had fewer chances to participate in student government, were less likely than others to have voted in a student election, run for office, or served on an SGA committee.
Table 9.5. Percentage of students who reported different forms of participation in student government.
Form of Participation in Student Government |
Percentage |
Voted in a student election at Holy Cross |
72 |
Ran for office in residence hall, class, or student government |
15 |
Served on a student government committee |
14 |
Is involvement in student government associated with broader political engagement? To see, we created two indices: an index of political participation consisting of the sum of five indicators in Table 9.1 and an index comprised of the sum of the “yes” responses to the three items in Table 9.5. There was indeed a significant positive correlation between these measures, which remained the same when controlling for academic class: as students’ involvement in campus politics increased, so did their political participation beyond the campus. Involvement in campus politics also was related, albeit weakly, to political knowledge and to interest in the current political campaigns and in government and public affairs.
Volunteerism
Although volunteering was the subject of last year’s survey, we also included a few questions this year that would measure students’ rate of volunteering. Applying the definition used in the Current Population Survey (CPS), we asked students to consider volunteering as “Activities for which people are not paid, except certain expenses, which the person did through or for an organization.” This definition thus excluded informal helping behavior. For example, a Holy Cross student who assisted a middle-school student with her homework through the Main South Homework Center would be considered a volunteer, but someone who, on her own, helped a fellow student with her homework would not.
In recent CPS surveys, a little less than a third of full-time college students nationally reported that they had volunteered in the past year. By comparison, over twice as many Holy Cross students (70%) said that they had volunteered during the current school year. Moreover, whereas fewer than half of U.S. college student volunteers engaged in volunteering on a regular basis (one a month or more), nearly all Holy Cross student volunteers do so “regularly.”
Aside from these comparisons, we were interested in the link between volunteering or community service and political participation. It is possible that volunteering nurtures political awareness, interest, and involvement, or that political engagement inspires community service. Although the associations were relatively weak, whether a student volunteered and the number of hours per week that he or she volunteered were significantly correlated with interest in politics and political participation. For example, the more hours per week students volunteered, the more likely that they were “very much interested” in the current political campaign (r = .12) and the higher their scores on the index of political participation (r = .24).
Opinions on Current Issues: Most Important Problem Facing the Nation
Another facet of politics is public opinion. We asked specifically about several prominent social issues. In addition, as in spring 2004, we asked a general question that has been posed repeatedly in national surveys: What do you think is the most important problem facing this country today? Unlike in 2004, when this question was asked before questions about specific issues, we conducted a split-ballot experiment, asking this open-ended question either before or after specific issues, in order to determine the effect of question order. Figure 9.1 presents the problems identified by 2 percent or more of the spring 2008 sample, irrespective of the order of the question. As the figure shows, the War in Iraq and the economy dominate student concerns.
Question order had a small, systemic effect on responses to the “most important problem” question. When this question was asked first, a greater percentage of respondents mentioned the War in Iraq as most important (42% vs. 29%); correspondingly, when this question was asked after questions about specific issues, respondents were more likely to mention one of the specific issues. In other words, asking about a range of issues seemed to prime respondents to consider problems other than the War when they were asked to identify the most important problem.
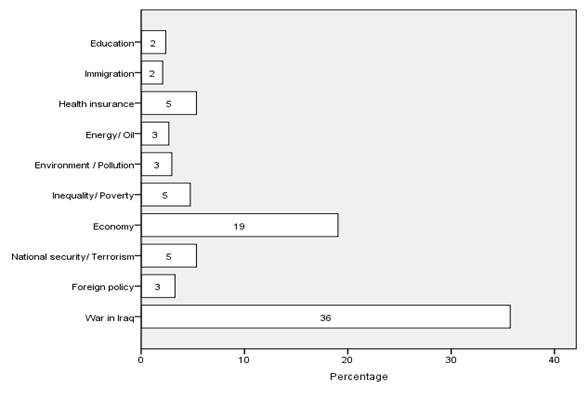
Figure 9.1. Problems identified by 2 percent or more respondents as “the most important problem facing the country today.”
The same question was asked in a Gallup poll on March 6-9, 2008, which was late in the HCSS interview period. At that time, the economy in general, with 35 percent, was considered the most important problem, followed by the situation/War in Iraq (21%), health care (8%), and fuel and oil prices (8%). Compared to the results of a January 2008 Gallup poll, this represents a slight decline in the percentage mentioning the War (from 25%), but a marked increase in those mentioning the economy (from 18%). When we tracked the percentage of students mentioning the economy over the course of the HCSS interview period, we found no such increase. So, Holy Cross students appear to have different concerns than a cross-section of the American public.
In the 2008 HCSS, Republicans were more likely than Democrats to identify the economy and national security or terrorism as the most important problem facing the country today, and Democrats were more likely to identify inequality; otherwise, their choices were similar. Women were more likely than men (42% vs. 28%) to say that the War in Iraq was the main problem. Finally, compared with the spring 2004 HCSS, students in 2008 were more likely to specify the War in Iraq as the most important problem (36% vs. 19%), but less likely to mention terrorism and foreign policy, both of which exceeded 10 percent in 2004.
Opinions on Other Current Issues
War in Iraq. At the beginning of the war, about 7 in 10 Americans thought that the U.S. had made the right decision in using military force against Iraq. Support for the War has declined markedly since then to the point that a February 2008 Gallup poll found that fewer than 4 in 10 Americans thought it was the right decision. Similarly, as of December 2003, a CNN/USA Today/Gallup poll indicated that 56 percent of Americans believed the war with Iraq had made the U.S. safer from terrorism; however, according to recent polls the majority of Americans now believe that the War has either made the U.S. less safe or that is has made no difference. If pollsters explicitly offer the option that it has made no difference, this is the most likely response. For example, this was true in a March CBS News poll in which 38 percent said that the military action against Iraq made the U.S. neither more safe nor less safe from terrorism; however, in an August 2007 CNN/Opinion Research Corporation poll, which asked simply if the war with Iraq has made the U.S. safer or less safe from terrorism. 49 percent said less safe and 42 percent said safer.
Holy Cross students expressed somewhat similar sentiments in both 2004 and 2008. In the 2008 HCSS, 37 percent said that the U.S. had done the right thing in taking military action against Iraq and 38 percent believed that the war has made the U.S. safer from terrorism. Also like the American public, a clear split in these opinions occurred along party lines, with Republicans expressing much stronger support for the war than Democrats. Nearly 70 percent of Republicans versus 15 percent of Democrats believed that invading Iraq was the right thing to do; 63 percent of Republicans versus 23 percent of Democrats believed the war has made the U.S. safer from terrorism.
The economy. With respect to the economy, Holy Cross students’ views were slightly less negative but just as pessimistic as the general public. When asked how they would rate economic conditions in the country today, 22 percent of the 2008 HCSS sample said “excellent” or “good,” 52 percent said “only fair,” and 25 percent said “poor”; by comparison, 19 percent of Americans in an early February USA Today/Gallup poll said excellent or good, 39 percent said only fair, and 42 percent said poor. When asked whether they thought “economic conditions in the country as a whole are getting worse or getting better,” 15 percent of Holy Cross students said better, 77 percent said worse, and 7 percent said neither. In the same USA Today/Gallup poll by comparison, 15 percent of Americans said better and 76 percent worse. As with the war in Iraq, Republicans and Democrats differed on both of these questions, with Republicans far more likely than Democrats to rate economic conditions favorably.
Illegal immigration. In June, 2007, the U.S. Senate blocked a comprehensive immigration reform bill introduced by John McCain and Ted Kennedy in 2005. The most controversial part of the bill provided a pathway to citizenship for undocumented (illegal) immigrants working in the United States. Another part of the bill was intended to enhance border security. With this in mind, we chose two questions from an ABC News poll in September 2007: Would you support or oppose a program giving illegal immigrants now living in the United States the right to live here legally if they pay a fine and meet other requirements? Do you think the United States is or is not doing enough to keep illegal immigrants from coming into this country? In a September 2007 ABC News poll, a majority (58%) of Americans supported a program permitting illegal immigrants to stay in the U.S., and two-thirds thought the U.S. was not doing enough to keep them out. The Holy Cross students we interviewed were more likely to support a program permitting illegal immigrants to stay (80%), but less likely to say that more needed to be done to keep illegal immigrants from entering the country (60%).
Illegal immigration was a hotly debated issue during the primaries, especially among the Republican candidates, as McCain was criticized by Mitt Romney and others for his position on the “amnesty” proposal. McCain and Obama also have exchanged views on this issue during the current campaign. At Holy Cross (as well as nationally), Republicans are more likely than Democrats to oppose legislation that permits illegal immigrants to stay in the U.S. (26% vs. 8%) and to believe that the U.S. is not doing enough to keep illegal immigrants out of the country (74% vs. 50%).
Health insurance. Another important issue facing the Presidential candidates is health care policy. Both candidates have put forth health insurance reform proposals that are being analyzed and debated. Many believe that any such proposal should provide affordable health insurance to all Americans. When a September CBS News poll asked, “How serious a problem is it for the United States that many Americans do not have health insurance?”, 70 percent said “very serious” and 25 percent said “somewhat serious.” Similarly, 67 percent of the Holy Cross sample said “very serious” and 30 percent said “somewhat serious.” Once again there was a sharp divide along party lines, with 78 percent of Democrats and 52 percent of Republicans stating that this is a “very serious” problem.
Energy and the Environment. Although energy and the environment often are linked, we asked independent questions about these issues in the HCSS. With respect to energy, we asked, “How serious would you say the energy situation is in the United States?” Nearly all respondents indicated that it was either “very serious” (46%) or “fairly serious” (50%), which is similar to the results of a 2007 Gallup poll. However, several respondents conveyed to us that this question was unclear. They seemed to wonder if “energy situation” meant rising fuel and gas prices, lack of alternative energy sources, the impact of oil and gas drilling on the environment, and so forth.
Reflecting one way in which energy and the environment are linked, we asked if respondents thought “there is too much, too little, or about the right amount of government regulation and involvement in the area of environmental protection.” In this case, Holy Cross students were more likely than the general public to answer “too little” (68% vs. 47% in an October Harris poll). We also asked students how they would “rate the condition of the natural environment in the world today.” Most HCSS respondents, similar to the general public in a 2007 national poll, rated the environment as either “fair” (54%) or “poor/very poor” (34%).
In response to all three of these questions, Republicans and Democrats at Holy Cross, like those nationally, differed. Republicans were less likely to state that the energy crisis was “very serious” (39% vs. 48%), that the government was doing “too little” about environmental protection (57% vs. 78%), and to rate the condition of the natural environment as “poor” or “very poor” (19% vs. 42%).
Abortion. We included a single question on abortion that has been asked numerous times in national surveys. The question addressed specific attitudes about its legality: “Do you think abortions should be legal under any circumstances, legal only under certain circumstances, or illegal in all circumstances?” Gallup polls over the past decade consistently have found that a slight majority of Americans believe that it should be legal only under certain circumstances, about 25 percent believe it should always be legal, and about 18-19 percent believe it should always be illegal. Holy Cross students did not differ significantly, as 52 percent of the sample said that abortion should be legal only under certain circumstances, 32 percent thought it always should be legal, and 14 percent that it always should be illegal.
Same-sex marriage. Holy Cross students and the American public diverge on the issue of gay marriage. Most polls show that the majority of the Americans think marriages between homosexuals should not be recognized by the law as valid, with the same rights as traditional marriages. In addition, an ABC News/Facebook poll in December 2007 found that 50 percent did not believe that homosexual couples should be legally permitted to adopt children. By contrast, 74 percent of students in the 2008 HCSS said that marriages between homosexuals should be recognized by the law as valid, and 84 percent said that homosexual should be legally permitted to adopt children. In large part, Holy Cross students’ position on gay marriage may be a product of two factors: age and education. Nationally, younger people and the more educated most strongly support gay marriage.
On the latter two social issues, Democrats versus Republicans and liberals versus conservatives in the HCSS were sharply divided. Democrats and liberals were far more likely than Republicans and conservatives to believe that abortion should be legal under any circumstances and gay marriage should be recognized by law as valid.
return to top
|